9 Secrets to Reducing your Fleet Expenses
As a fleet owner, your day-to-day costs can quickly add up. What you don’t know is there are further hidden, expensive...
Read more
The modern world runs on data. We create and consume more than ever before. In fact, 90% of all data ever generated was produced in the last two years.
Your fleet is contributing to this – producing a constant stream of data on everything from fuel consumption, vehicle health, driver behaviour and more. When leveraged correctly, fleet data has the potential to transform your business, helping you work smarter, make more informed decisions and improve the efficiency of your operation.
But, when it comes to putting this valuable data to good use, the old adage is true: a picture paints a thousand words. That is to say, the way you present your data is just as important as the fact that you collect it at all.
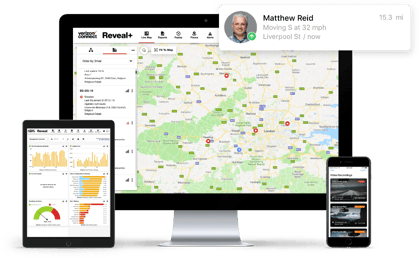
Data is at its most powerful when it can be quickly analysed and easily understood. Presenting your fleet data in a visual format, through charts, graphs and infographics, is one of the most effective ways to ensure that this is the case.
Not only is data that’s presented in this way easier on the eye, it also means that we are far more likely to remember its contents. Studies have shown that when we hear information, we are likely to remember just 10% of it three days later. However, when we receive data in a visual way, most people retain up to 65% of the information three days later.
Data represented visually is also far easier and faster to digest. In fact, the human brain is said to process visuals up to 60,000 times faster than it does text only information. When analysing visual information, as opposed to trawling through line after line of data, it is much easier to spot anomalies and outliers.
Perhaps most importantly of all, presenting data in a visual way makes it far more accessible – meaning every member of your team can have access to the data they need, when they need it, in a format that is easy to understand.
Access to intuitive, easy-to-use dashboards is just one of the many benefits of using GPS tracking software to manage your fleet data. Find out more.
Tags: All


Find out how our platform gives you the visibility you need to get more done.
As a fleet owner, your day-to-day costs can quickly add up. What you don’t know is there are further hidden, expensive...
Read moreVerizon Connect Reveal tracks the fleet data that can have a big impact on your business. These are things like where...
Read moreAt Verizon Connect, we can only provide the highest possible level of service to fleet managers and business owners by...
Read moreReveal tracks the fleet data that can have a big impact on your business. These are things like where your vehicles are...
Read more